Looking at the campaign financial data reported after the 2014 election, spending by winners ran as high as $5 per vote for the Lord Mayor position and averaged $2+ for each vote received by new Council candidates.
You needed $100 ($200 for Lord Mayor) and 25 signatures to get your name on the Oct. 22 ballot. However, to actually make people aware of your candidacy, it takes a lot of time to knock on doors, attend candidates’ meetings and meet people in the different neighbourhoods of town. For most candidates, it also takes money – usually donations from businesses or residents – spent on signs, advertising, brochures, websites, meetings, consultants and other eligible expenses.
2014 Lord Mayor spending per vote
In the 2014 election, $27,836 was spent by the two men running for Lord Mayor. The winner, Pat Darte, was taking on an incumbent and spent $18,249. That was almost double Dave Eke’s $9,587 spending.
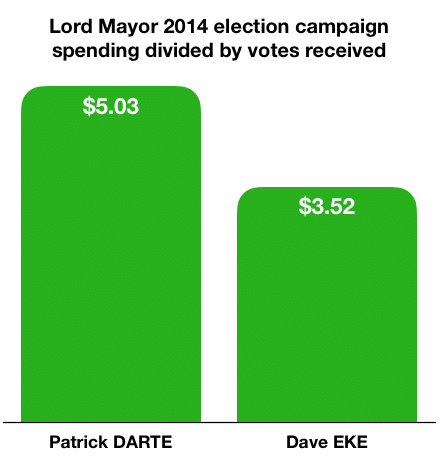
Darte won with 57% of the votes to Eke’s 43%. When I divide each candidate’s spending by the number of votes each received, the result is a crude measurement of “cost per vote” with Darte averaging $5.03 for the 3,627 votes he received versus $3.52 for the 2,723 votes for Eke (see chart).
To be clear, I am not saying that candidates can “buy votes.” However, the ratio provides a way to compare the investment made in trying to win election in terms of how many people voted for that candidate.
The 2018 contest for Lord Mayor sees 3 contenders – incumbent Darte against Betty Disero, who served 4 years on council, and 23-year-old Daniel Turner.
2014 Regional Council spending per vote
In 2014, the two candidates for the elected Regional Council seat had also run against each other in 2010 – incumbent Gary Burroughs and Dave Lepp, who had previously served on Regional Council (and is running again in 2018). Their total spending was $20,874, but Burroughs with $16,950 out-spent Lepp, who only spent $3,924, 4 to 1.
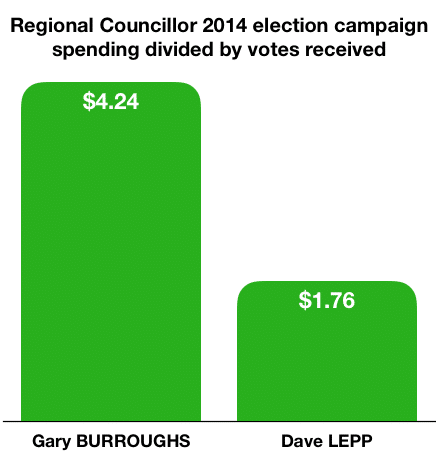
Burroughs won 64% of the vote to Lepp’s 36%. Dividing the spending by each candidate by their votes received, Burroughs averaged $4.24 per vote for his 3,998 votes versus $1.76 for Lepp’s 2,225 votes (see chart).
In 2018, Burroughs has changed his ambition to town Council so is not seeking re-election for the region. There are 4 candidates competing: Mark Cherney, Dave Lepp, Chuck McShane and Gary Zalepa.
2014 Town Council spending per vote
In 2014, the 16 candidates running for the 8 seats on Town Council spent a total of $55,207. Instead of looking at individual ratios, I grouped the 15 candidates with some spending into 4 segments and totalled the spending and votes for each segment (the last-place finisher reported zero spending):
- The 5 incumbents who won re-election
- The 2 incumbents who did not win
- The 3 new candidates elected
- The 5 new candidates who did not win
These segments illustrate the generally accepted notion that incumbents have an advantage of name recognition, which usually works in their favour unless they’ve disappointed some people. It usually means they don’t need to spend as much to build up popular support.
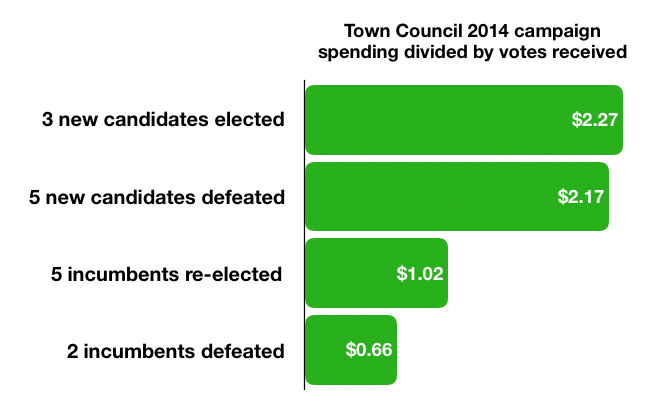
For instance, the 5 incumbents who were re-elected spent an average of $3,100 each and their total spending divided by total votes works out to $1.02 per vote (see chart).
The 2014 race was very close for the #8 spot, with 2 incumbents being defeated – ending up in the #9 and #10 spot. The two spent an average of $1,467 each and their total works out to only $0.66 per vote.
Meanwhile, candidates who are new to the voters need to spend more on signs, advertising and meetings in order to introduce themselves and advocate their issues.
In 2014, the 3 new candidates who were elected averaged $2.27 per vote, but there was a big range between the new candidate who was the top vote-getter, John Wiens with 3,641 votes, who had considerable local name recognition from his business dealings and who spent an average of only $0.97 per vote, and the new candidate who came in 4th place overall, Betty Disero with 3,330 votes, who spent an average of $3.86 per vote.
Among the 5 new candidates with some spending, their expenses worked out to an average of $2.17 per vote, but the range at the per-candidate level was $0.44 to $3.40.
In 2018, there are 24 candidates for the 8 spots on Council.
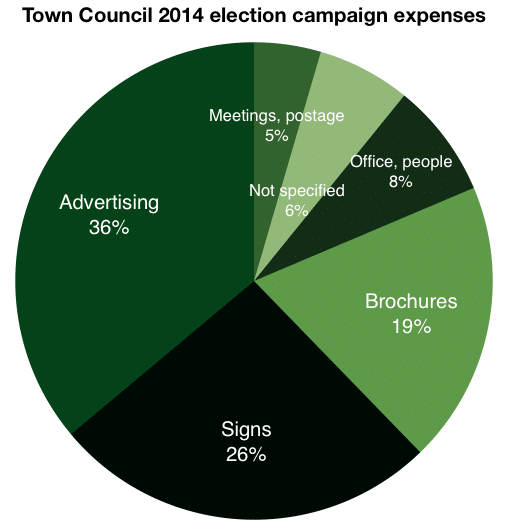
What money gets spent on
Looking at what the money gets spent on, there really aren’t any surprises. There are standard expense lines on the reporting forms. I totalled the expenses lines for the 15 Council candidates. The biggest portion of the pie, 36%, goes to advertising, followed by signs at 26% and brochures at 19%. The smaller portions are for office expenses, people such as consultants, postage and meetings.
The filing of these expense forms is part of the process of trying to ensure that the democratic process is transparent. However, I’m not sure if anyone ever looks at the forms afterward unless a losing candidate is suspicious about something.
For instance, of the 16 expense forms for Council that I reviewed, which were duly signed by candidates and witnessed by the town clerk, 4 of the filings are incomplete in that they do not show a complete breakdown of how money was spent. That’s the 6% shown on the pie chart as “not specified.”