Be smart when voting for NOTL Council. It’s not only who you support, but also how many of the 24 candidates you select on the ballot.
In the 2014 Niagara-on-the-Lake (NOTL) municipal election, the difference between winning or losing a Council seat came down to just 10 votes. That is to say, 10 voters out of a total of 6,531 electors determined who ended up in the #8 spot and therefore with a seat on Council. In 2014, there were 16 candidates for the 8 positions. In 2018, we have a slate of 24 candidates. Although you can vote for as many as 8 candidates, it is more effective to limit the number of candidates you support (unless there are, in fact, 8 candidates who you think will do a good job).
Don’t vote for “too many” candidates
It sounds contradictory, but you can actually vote for “too many” candidates. For example, some people may be confident supporting one or two or three candidates, so they tick their names on the ballot. However, they may decide to “fill out the ballot” because they can vote for up to 8, and they end up picking names they might recognize but don’t necessarily have a solid reason to support. The problem is, by voting for these “other” candidates you can potentially move them up the list – above the people you really want to see win.
If you really are supporting only one or two or three or four or five people, it’s best to only vote for them. Otherwise, any additional votes you cast are, in effect, votes against the candidates you prefer. When there is at-large voting (as opposed to wards), picking only a few candidates is called “strategic voting” or “tactical voting” or “bullet voting.”
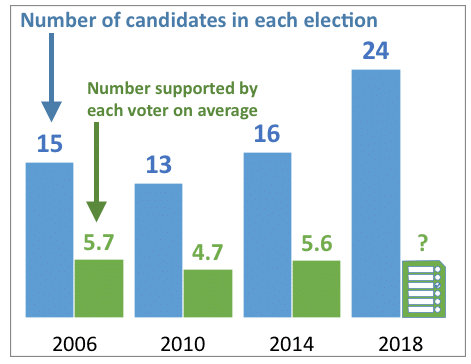
Past patterns suggest that with a record 24 candidates on the ballot in 2018, the temptation will be for a voter to tick off more names on the ballot. On average, voters selected 5.6 out of 16 candidates in 2014 and 5.7 out of 15 candidates in 2006, but only 4.7 out of 13 candidates in 2010.
Certainly, if you are confident about 8 candidates, then vote for 8. But understand how close the final tally can be in terms of who ends up being elected. For more info:
What it takes to win in terms of vote count
There are many factors that influence how many candidates a voter decides to support, such as the number of incumbents and the quality of the people running for office. A voter can vote for as many as 8 candidates because there are 8 seats on Council.
In the 2006 and 2010 elections, a Council candidate needed to secure 2,500 or more votes to win – about 40% support (votes for the candidate as a percentage of the total voters). In the 2014 race, a candidate needed 2,235 votes to win – about 35% support.
While there usually are candidates at the top and the bottom in terms of support, most end up closely grouped in the middle. When the votes are tallied, often there are fewer than 100 votes between one candidate and the next.
With 24 names on the 2018 ballot, it’s likely that the spread between votes will be even tighter than in the 2014 race with its 16 candidates.
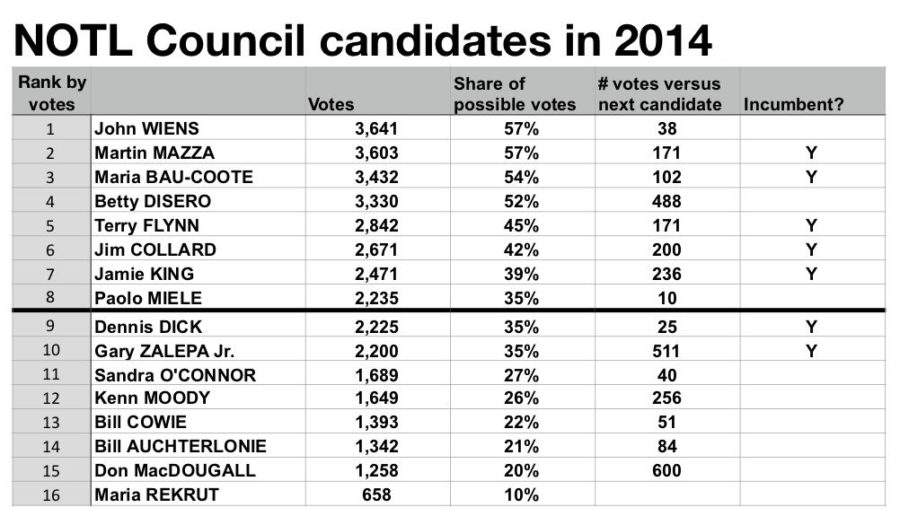
The 2014 Council results
In 2014, each of the 6,350 voters chose 5.6 candidates on average from the 16 names on the ballot. The top two candidates for Council were supported by 57% of the voters while the candidate at the bottom got 10% support. Six candidates had fewer than 100 votes between them and the next person. In fact, three candidates – two of them incumbents – each got about 35% support in the #8, #9 and #10 spot. There was a spread of only 10 votes between #8 and #9. Only 35 votes separated #8 and #10. Those small margins show how much each single vote matters.
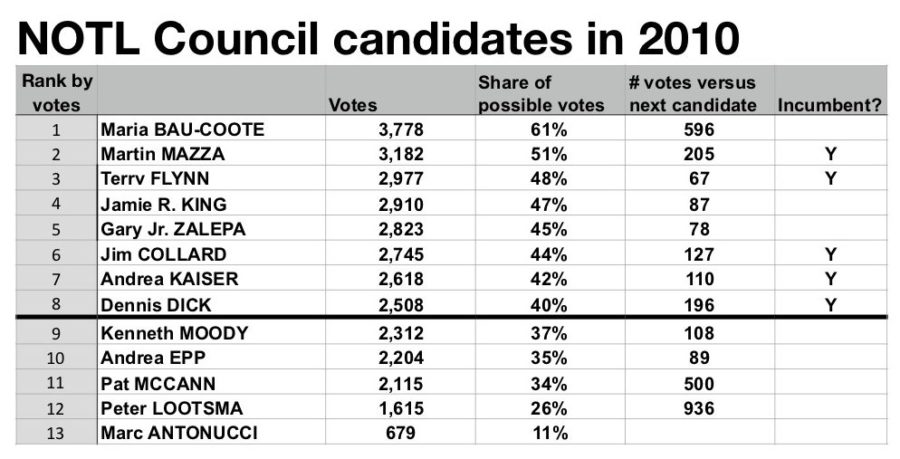
The 2010 Council results
In 2010, the 6,213 voters chose an average of 4.7 candidates from the 13 names on the ballot. Four candidates finished with fewer than 100 votes between them and the next person.
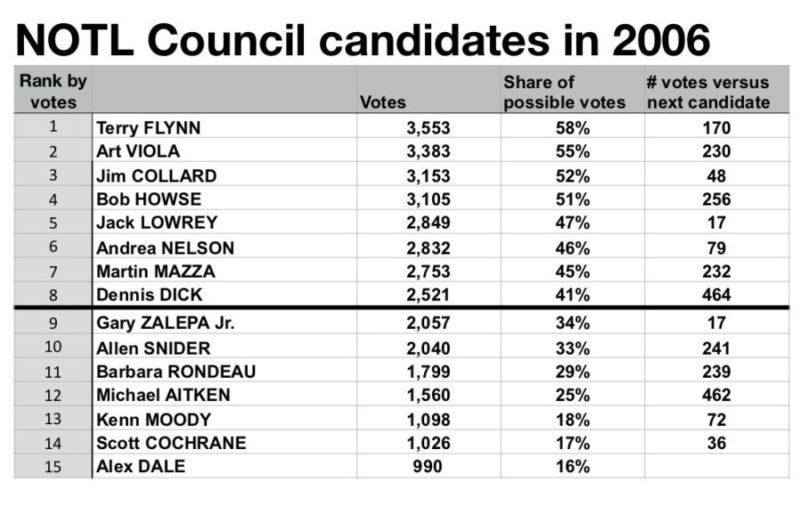
The 2006 Council results
In 2006, the 6,118 voters chose an average of 5.7 candidates from the 15 names on the ballot. Six candidates finished with fewer than 100 votes between them and the next person.