Candidates spent $182,181 to win 10 offices in the 2018 NOTL election.
In the October 2018 municipal election in Niagara on the Lake, 32 people campaigned for 10 elected seats. Voters paid attention, with a turnout of 58% (up from 48% in the three previous local elections).
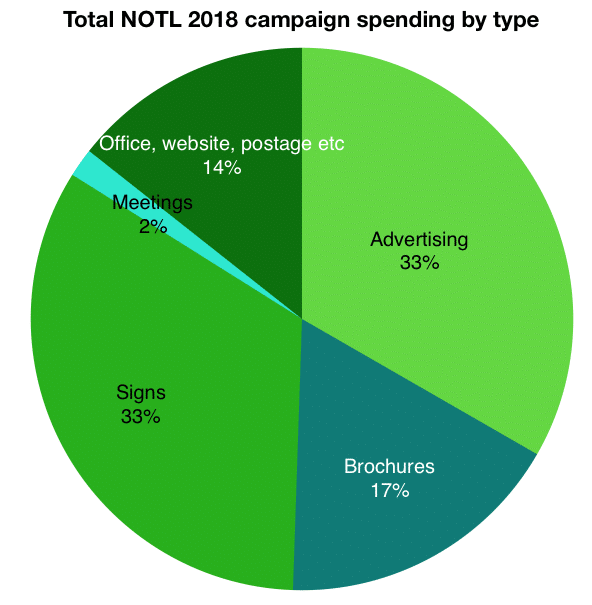
Campaign spending by type
Based on analysis of the financial reports of 29 candidates (three failed to file), spending totalled more than $182,181 for the positions of Lord Mayor, Regional Councillor and eight Town Councillor seats.
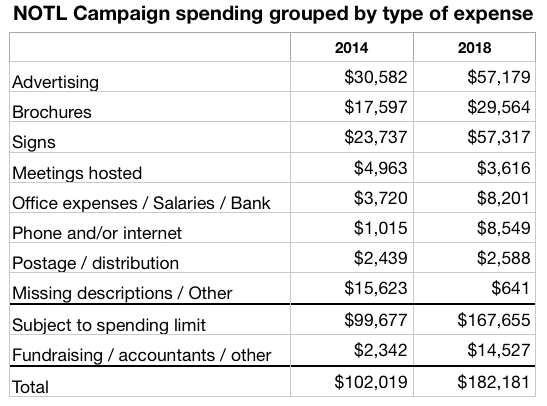
I’ve compiled the data from the 29 candidate disclosures in order to look at the types of expenses (see pie chart) and to make a comparison with total spending in the 2014 campaign (see table). [May 21 Update: This article and data now includes the a late disclosure just released on the Town website. ]
I think that it takes a sense of civic service and a commitment to make time to meet with potential voters before the election to be a successful candidate. However, it also requires some money to advertise your interest in being elected, whether it’s with yard signs, brochures, a website, or meet-and-greet sessions. Certainly, in 2018 an impressive number of people stood for election, motivated in part perhaps because there was no incumbent running for Regional Councillor and there were only four incumbents running for the eight Town Council seats.
The requirement for financial disclosure is to ensure visibility for who provides the money for a candidate – a count of all donations, with a list of names included if the amount is more than $100, and a breakdown of how the money gets spent.
Observations about disclosures
Based on a review of the tallies and the actual 2018 disclosure reports:
- Flaws noticed with incomplete reporting in 2014 not avoided this time. In 2014, at least five candidates neglected to completely document how they spent a total of $15,623. Their disclosures did not add up to the total reported. In 2018, there was complete disclosure of how money was spent, and all the numbers added up.
- After the election, the 32 candidates had seven days to take down and pick up election signs. All had until March 29, 2019, to file their campaign financial disclosure with the Town Clerk, and 28 filed on time. One filed late, but within 30 days. Three Council candidates failed to file financial disclosure at all and now are ineligible to run for office or be appointed to fill a vacancy until after the 2022 election, according to provincial law.
Spending per candidate
- Of the 29 reporting in 2018, the average spent per candidate was $6,287. That compares to 2014 when total spending of $102,019 divided by 20 candidates averaged $5,100.
- Averages can be misleading. In 2018, one candidate (Betty Disero) reported spending of $28,333 and five candidates reported spending under $2,500 each.
Good for local papers
- In 2018, $57,179 – 33% of the total spending – went for advertising. Of that, I estimate that about half ended up in the new local newspaper, The Lake Report, which had launched in May 2018. The paper, operated by young journalist and entrepreneur Harley Davidson (aka Richard Harley), printed a 28-page election special edition full of paid messages from the Lord Mayor and Town Councillor candidates. My estimate is that the special issue probably collected as much as $20,000 in advertising fees while, based on typical costs, incurring out-of-pocket expenses of about $5,000 to print and distribute copies via the local post office.
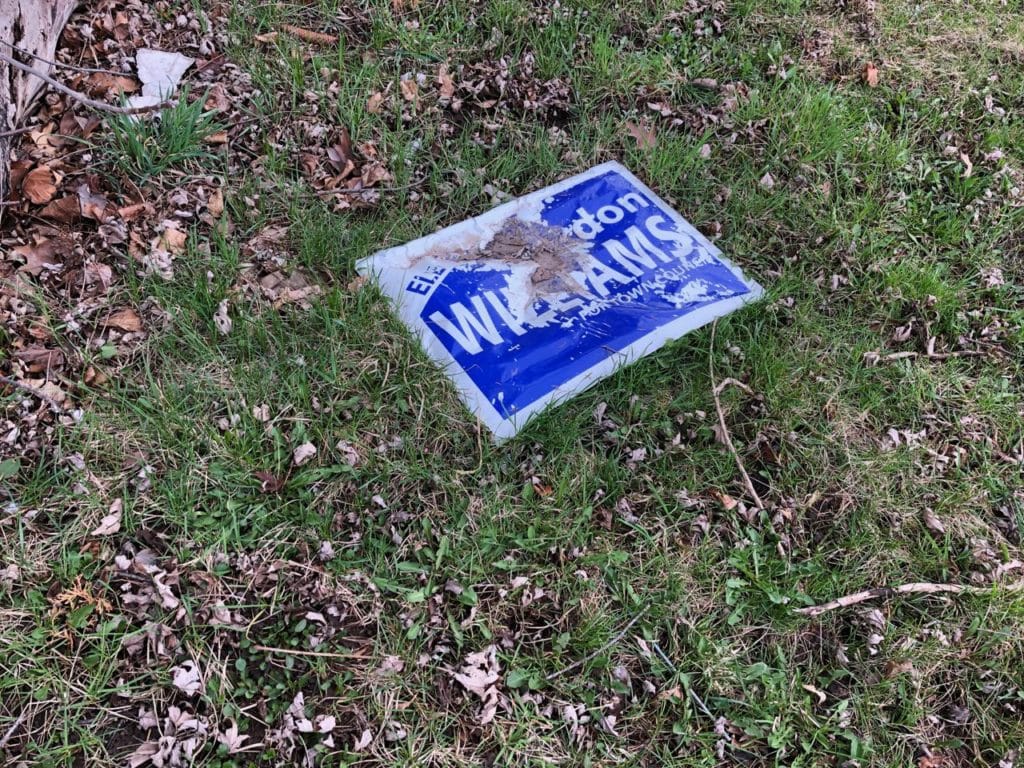
- Another 33% of campaign spending, $57,317, was for yard signs. With the surge in first-time candidates, many signs clustered in front of homes and farms because the Town in 2018 restricted placement on public property.
- In percentage terms, the biggest change in 2018 spending versus 2014 was for the line item “telephone and/or internet,” up to $8,549 from $1,015 as more candidates provided robust websites.
How they raised money
- While several candidates benefitted from well-organized fundraising, eight of the 29 candidates reported that 100% of their campaign income came from either money or goods and services contributed by themselves or their spouses. For another eight, the value of donations reported by them or their spouses totalled more than 65% of their expenses. That makes a total of 15, or more than half, who self-financed at least 65% of their campaign.
- Donations of more than $100 need to be disclosed. Disero ran a widely financed campaign, with a list of 51 contributors of $100 or more. In the donations over $100, other well-supported candidates included Gary Burroughs with 24 such donors, Wendy Cheropita with 18, Clare Cameron with 17, Alan Bisback with 14, and Pat Darte and Chuck McShane, each with 11. [May 4 Correction: I made a mistake and included Crispin Bottomley in my initial list. I apologize.]
- None of the candidates exceeded the spending limit ($19,581 each for Lord Mayor and $16,454 for other offices), but Disero ran close to the limit which restricts spending on advertising, signs and other pre-election campaigning. She was able to categorize $8,028 of her costs as not subject to the spending limit because they were related to fund-raising for the sale of 300 tickets at $50 each that raised $15,000 for an August launch party as well as for volunteer thank you events after the election and accounting.
- Any candidate who raises more than they spend needs to donate the balance remaining to the Town, and several did so with small amounts.
Lord Mayor race
In the campaign for Lord Mayor, Betty Disero won 50% of the vote versus 33% for incumbent Pat Darte and 17% for political neophyte Daniel Turner.
Spending by the three totalled $51,486 versus a total in 2014 of $27,837 for Darte and then-incumbent Dave Eke. Interestingly, in 2014 Darte had spent $18,250 to defeat incumbent Dave Eke, but scaled back spending by a third in 2018. Darte reported 73% of his campaign contributions in 2018 as money or goods and services “from candidate and spouse” while Turner reported 67%.

Regional Councillor campaign
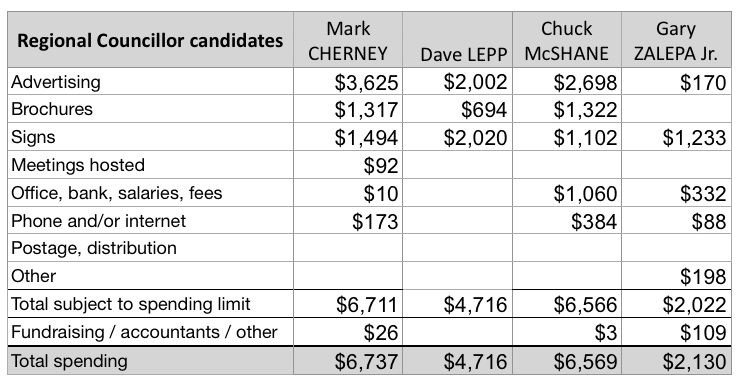
With no incumbent running for Regional Councillor in 2018, there was a four-person race. Notably, Gary Zalepa Jr. spent the least of the candidates but won with 32% of the votes. Anecdotally, Zalepa was visible at most of the candidate open house events for Town Council positions, often standing at the side of a room where he could be easily approached by interested people. His victory may indicate that investing time in out-reach is as important as the spending on signs and brochures.
The second-place finisher, David Lepp, got 30% of the votes. He filed his financial disclosure for 2018 late, on April 27, and paid a $500 penalty. Mark Cherney polled 22% and Chuck McShane came in last with 16%.
The four spent a total $20,186 for 2018 versus $20,875 spent by two candidates in 2014. (In the 2014 election for Regional Councillor, Lepp spent $3,924 when he lost to Gary Burroughs who spent $16,951.)
Town Council contest
With 25 names on the ballot for eight seats on Town Council in 2018, the competition was keen to capture the attention of voters. On average, voters picked 6.1 candidates. Notably, such was the disappointment with the previous Council that only one of four incumbents was re-elected (see article Stunning wins).
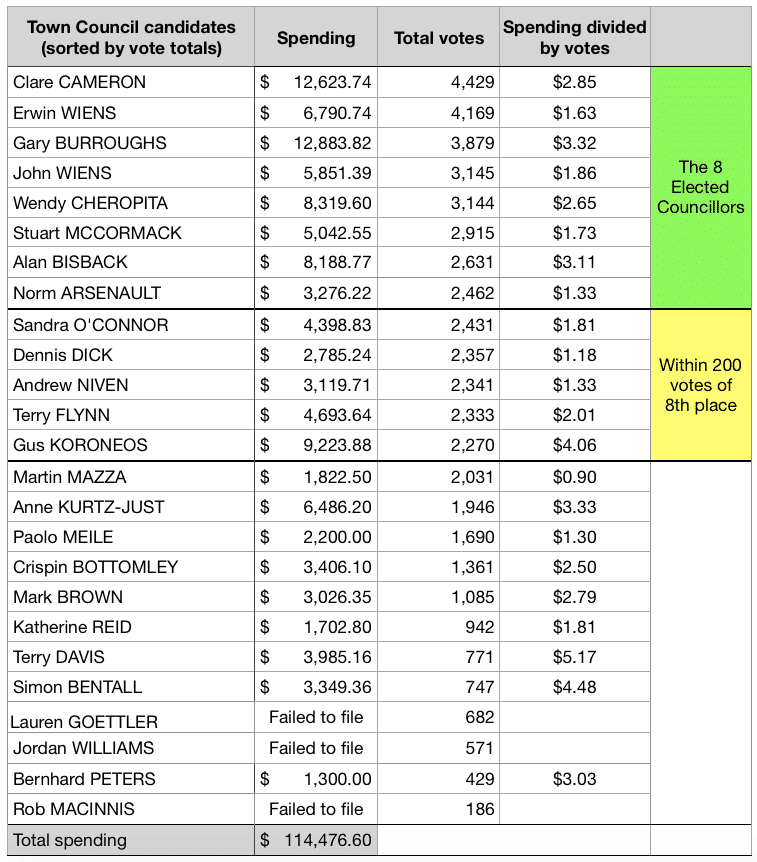
The 22 Council candidates who filed disclosures totalled $114,477 in spending, more than double the $55,2017 spent by 16 candidates in 2014.
As with the Regional Councillor race, there was not a clear correlation between the amount spent and the votes received. In the table below, the 25 candidates are ranked by votes received. For each, their spending is divided by their votes, in order to provide a ratio for comparison purposes.
I’ve noted the eight with the most votes who were elected. Also, another five candidates each came within 200 votes of the 8th place winner. Once again, this demonstrates the conventional wisdom that it’s worth the time and effort to try to contact and engage with as many potential voters as possible.
Disclosures
- In keeping with the practices of responsible journalism, I disclose that my wife or I donated to several candidates as well as to the third-party group that organized the Council candidates open houses at the Legion.
- Article updated May 4 for a correction noted above and on May 21 to include a 29th financial disclosure.