In fact, there is relative consistency in voting patterns between the five polls in Niagara-on-the-Lake.
It’s fascinating how many people believe that voting patterns vary across Niagara-on-the-Lake (NOTL) based on where people live. Some Old Town residents, when unhappy about how things are going on Town Council, blame the voters in Virgil. Others will say farmers worry that the people in Old Town don’t support their interests. Some folks jump to the conclusion that a ward system would be better than our at-large voting for the 8 Council seats.
I’ve looked at the voting patterns in the five poll districts in the 2014 election. The five polls are really administrative geographical groupings, but provide a way to look at how candidates appeal across NOTL. For the first time in 2014, a NOTL voter could “vote anywhere” at one of five polling locations (reduced from 8 locations in 2010). However, regardless of where one votes, all but 424 of the 6,531 votes cast in 2014 can be attributed back to where the voter is registered – either Old Town, Virgil, Queenston, St. Davids or Glendale. (For the 2018 election, Town Clerk Peter Todd wanted to consolidate the number of voting locations from five to three, but changed his decision in April 2018 following objections.)
Naturally, some voters tend to support someone who lives in their polling district. But it’s not evident that overwhelming support in one poll offsets a poor showing in another poll. If the outcome were decided by the voting poll rather than at large across NOTL, the same person would have ended up as Regional Councillor, the same person would have ended up as Lord Mayor (except in Virgil where it was close) and 7 of the 8 Councillors would have ended up on Council (except in Virgil where two locals polled better). When you look at the actual vote shares, you can see how the pattern of support for individual candidates between polls is more alike than different.
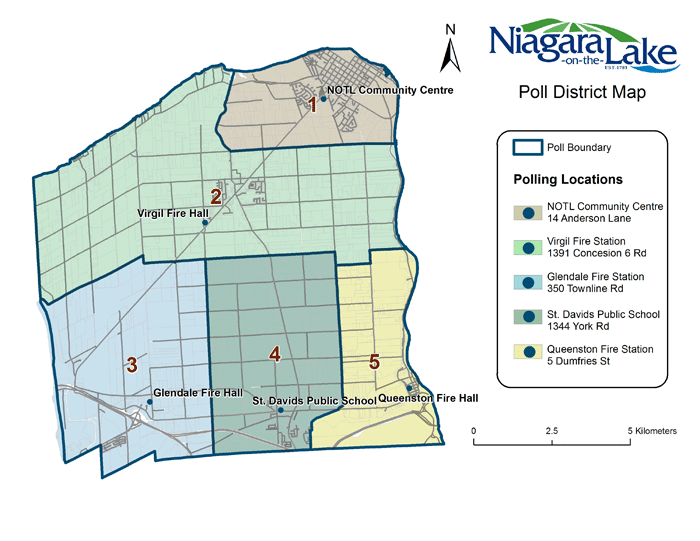
Significantly, there are differences in voter participation between the different polls. Using the votes for Lord Mayor as the measure of voter turnout, overall participation was 46% but ranged from a high of 57% in St. Davids to only 7% in Glendale. (Of the 357 people who voted for Lord Mayor at the Glendale poll, all but 74 were registered at other polls.)
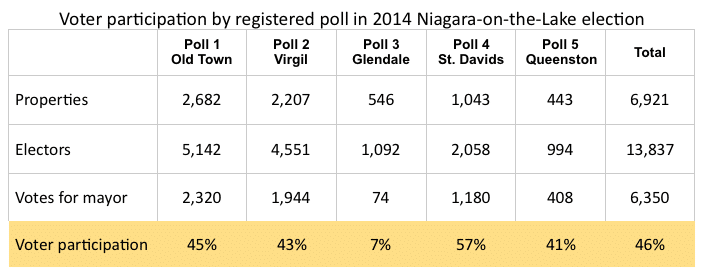
Of all voters, 38% were in Old Town, 30% in Virgil, 18% in St. David’s, 6% in Queenston, and 1% in Glendale.
The 2014 race for Regional Councillor
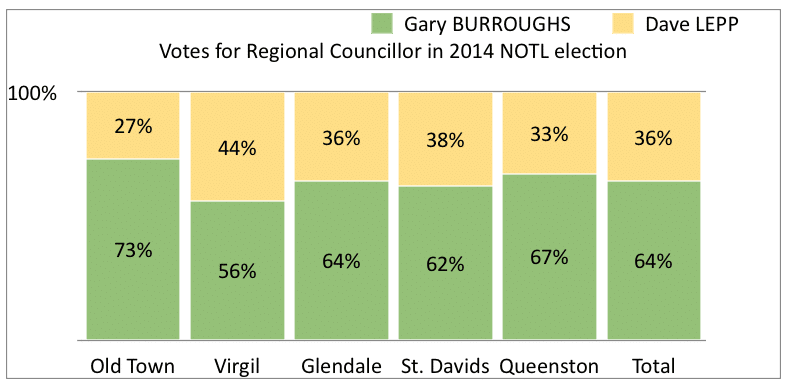
The Regional Councillor race in 2014 was a repeat contest. The two candidates – Gary Burroughs and Dave Lepp – had run against each other in 2010 when Burroughs won 52% of the vote. In 2014, Burroughs widened his margin to 64% overall support. He won in all five polls, with very strong support in Old Town.
In 2018, Burroughs is not seeking re-election for the region, so there are 4 candidates competing: Mark Cherney, Dave Lepp, Chuck McShane and Gary Zalepa.
The 2014 race for Lord Mayor
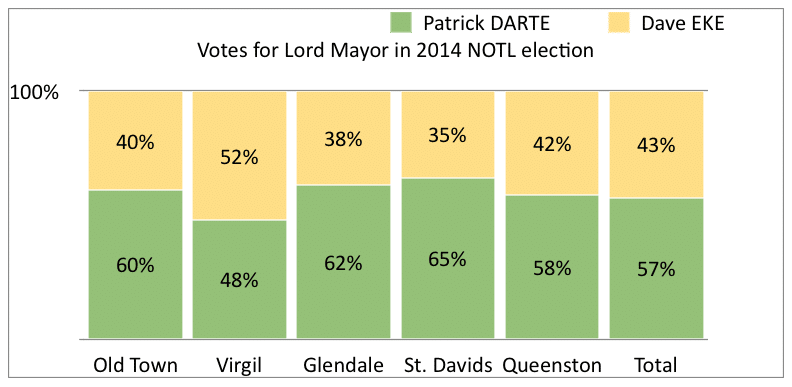
In 2014, Dave Eke was seeking re-election as Lord Mayor having won in 2010 in a race with 4 candidates when he got only 38% of the overall vote. His challenger in 2014, Pat Darte, had been in second place for Lord Mayor in 2010 with 25% support. In the 2014 results, Darte won with 57% overall and won in 4 of the 5 polls.
In 2018, Darte faces two challengers: Betty Disero, who has been on Council, and political neophyte Daniel Turner.
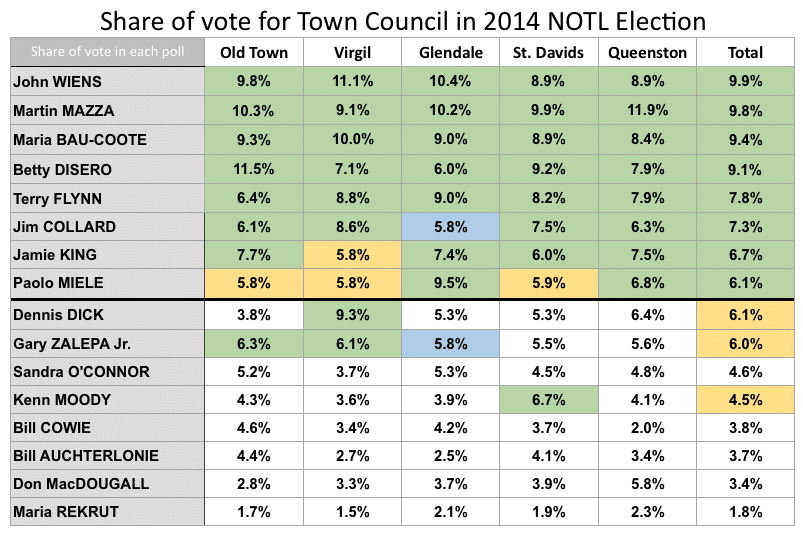
The 2014 race for Town Council
In 2014, there were 16 candidates including 7 incumbents vying for the 8 Council positions. The results were close with as few as 10 voters out of 6,531 voters deciding who won the #8 spot (see this article). Nonetheless, when you look at the share of vote that each of the 16 candidates received in each poll, 7 of the overall 8 winners would have won in all polls (except Virgil where Dennis Dick and Gary Zalepa were strong). Zalepa also won in Old Town and tied in Glendale. Kenn Moody won in St. Davids.
My conclusions
While there are some differences in voting patterns by poll, they may reflect campaigning efforts by candidates rather than voter prejudices. To end up winning, a candidate needs to garner sufficient support in all polls. They need to ring more doorbells, talk to more people, listen to more voters concerns, show up at more candidate meetings, and generally work harder to get elected.