The number of voters in 2018 increased in all five polls in Niagara on the Lake, but the Old Town turnout hit an impressive 70%.
Our friend Sally, who lives around the corner, emailed me last week: “Question: can you figure out what percentage of Old Town persons voted, as compared to what percentage from Virgil or from St Davids? Did more crabby Old Towners turn out or did generally more folks vote?”
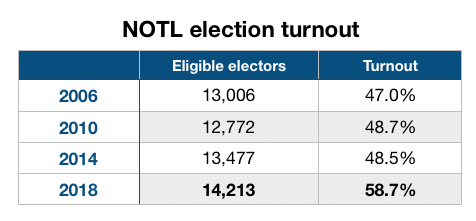
We already knew that the overall Niagara on the Lake turnout of 58.7% in 2018 was up from 48.5% in 2014 because 1,812 more voters went to the polls (see article Stunning wins in NOTL with 58% turnout). But, we didn’t know the turnout by poll. The Town does not release turnout statistics, or even the number of ballots cast, by poll. However, after a few inquiries, Town Clerk Peter Todd did provide me with the five numbers that I needed: the number of eligible electors by poll. As I did with my 2014 analysis, I used the tally of votes cast for all Lord Mayor candidates in each poll as the “voter turnout” count because I assume that if someone is taking the time to vote, they likely cast a choice for the top job.
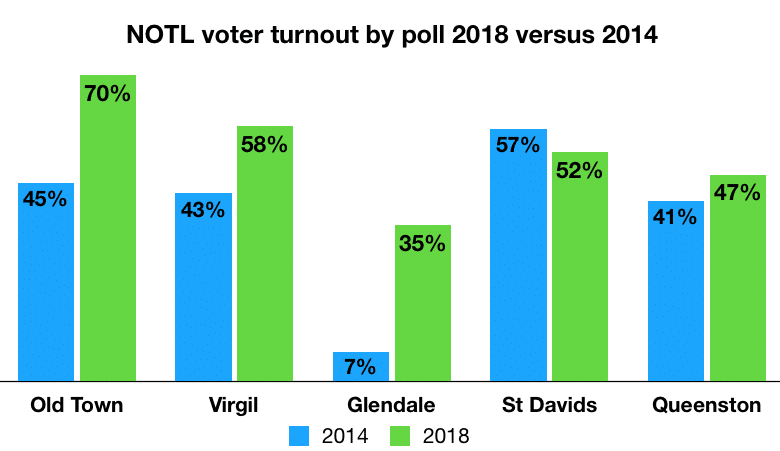
The tally: seven out of 10 eligible electors in Old Town did vote – a 70% turnout in Old Town followed by 58% in Virgil, 52% in St Davids, 47% in Queenston and even 35% in Glendale (up from 7% there four years ago). In fact, there were more voters in all five polls, as I reported in a previous article (Old Town voters determined who got elected).
What looks like a dip in turnout to 52% from 57% in St Davids is simply because, although 173 more people there voted, that is where almost all of the NOTL’s overall increase in eligible voters showed up in 2018. Three polls – Old Town, Queenston and Virgil – had fewer eligible voters than in 2014. (For the distinction between potential voters and eligible voters, see NOTL turnout likely to be up.)
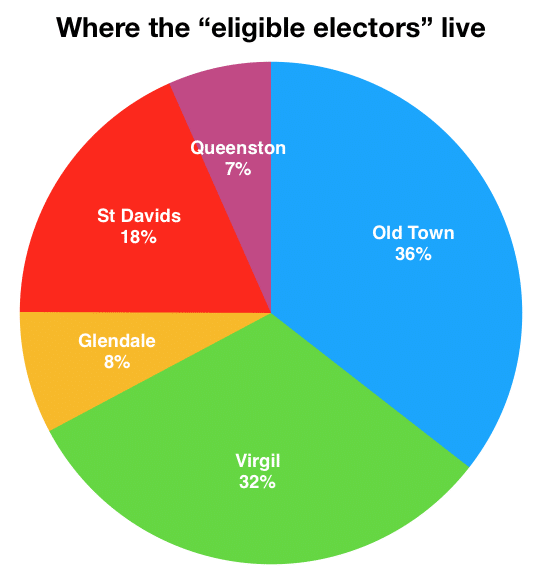
Old Town and Virgil combined account for two thirds of eligible voters, but St Davids is where, as noted, almost all of the increase in eligible voters to a total of 14,213 occurred between 2014 and 2018.
Where the votes get counted
On election night, if you were watching the town’s livestream of voting results either at the Community Centre or at home on your device of choice, you would have seen that the results came in over an hour or so in waves of various sizes. There were 13 voting places to be tallied and reported, so the first tally was 2 of 13 reporting, then 3 of 13, etc.
Using the vote tallies for Lord Mayor, I’ve made a pie chart to show how many votes were cast where or when – that is, at one of two polls at the Community Centre, etc. You get an appreciation of the logistics that Town staff need to manage in order to try to provide a convenient venue and time for voting for as many people as possible.
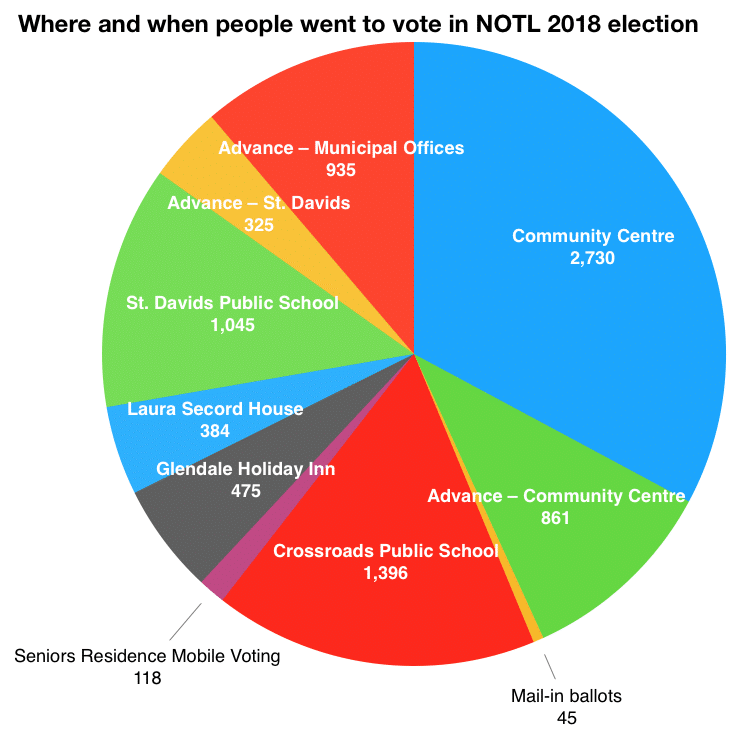
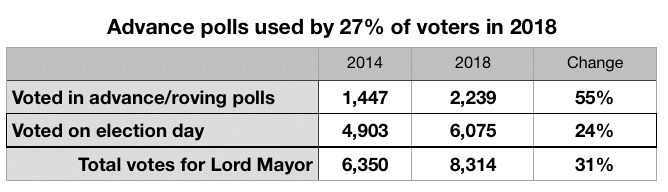
People voting in advance polls had reported that there seemed to be a lot of other people also voting ahead of the election. This shows up in the final numbers, too. There was a 55% increase in advance poll ballots. Advance poll voters made up of 27% of all voters.