With 24 candidates running for the 8 seats on NOTL Council, plus the 22 other candidates running for 4 other positions, we see lots of yard signs. Also, we’ll probably see more voters go to the polls.
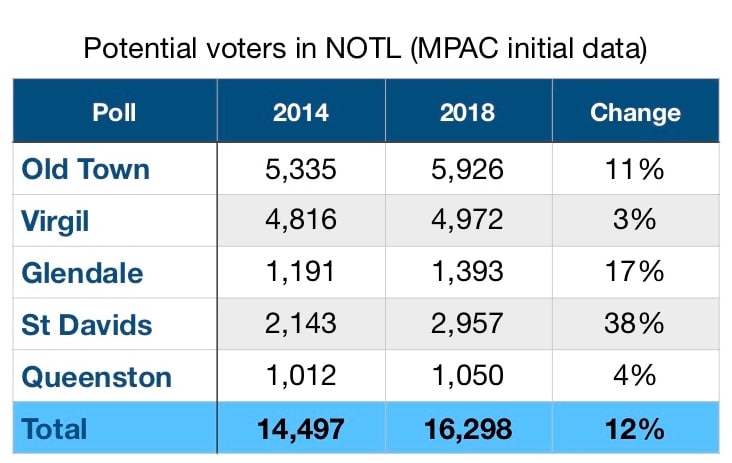
Voter turnout at the municipal level is often lower than for federal or provincial elections, but we saw a jump in turnout provincially this year. The level of interest in Town Council seems higher because of development pressures in all areas, especially Old Town and St. Davids. There are 12% more potential voters in 2018 versus 2014 because of population growth, which likely will result in an increase in eligible voters of at least 5%.
Provincially, Ontario historically has the lowest level of voter participation compared to other provinces. However, in the June 2018 provincial election, voter turnout jumped to 58% from 51% in 2014. That was the highest level in almost 20 years in Ontario. Of course, it pales in comparison to the 67% who voted on October 2 in Quebec (down from 71% in 2014 in Quebec).
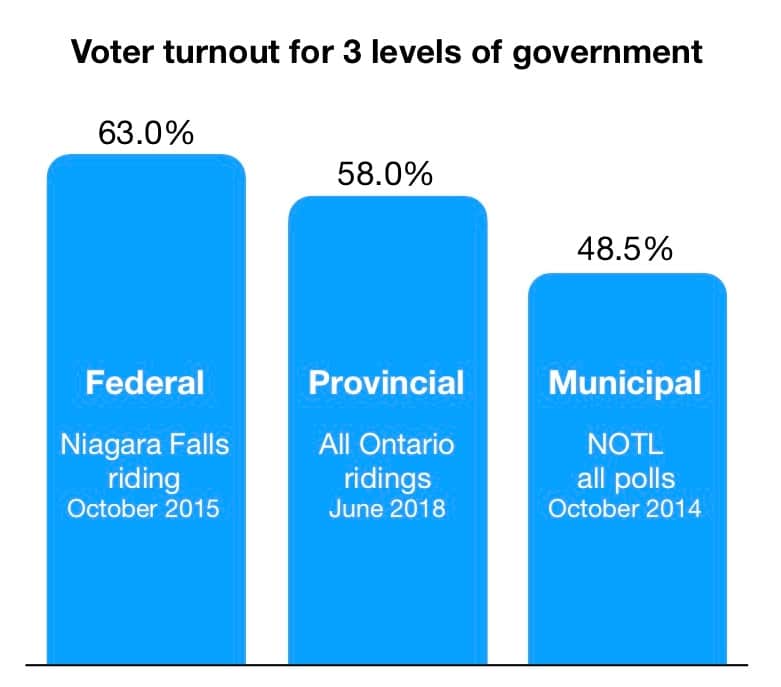
Federally, the Niagara Falls riding that includes Niagara on the Lake saw a 63% voter turnout in 2015.
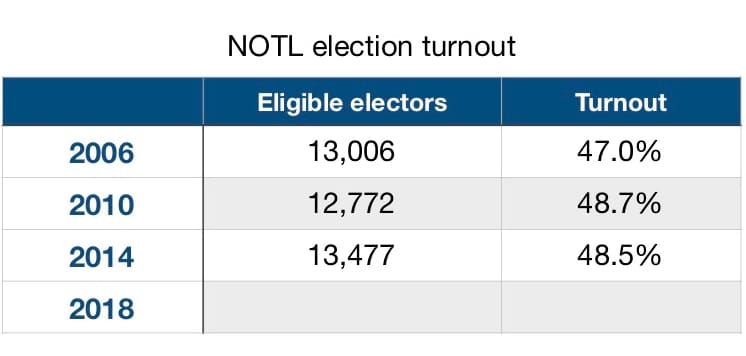
At the municipal level, turnout has been in the 48% range for several elections (versus 58% for the provincial election and 63% for the last federal election). However, in NOTL, the sheer number of potential voters is increasing with all the new housing development.
Trends in potential voters
The tremendous growth in population is reflected in a 12% increase in the potential elector counts reported to the Town earlier this year by the Municipal Property Assessment Corporation (MPAC), the folks who evaluate what your house or farm or other property is worth so you can pay your share of property taxes.
Looking at the preliminary MPAC counts from 2014 versus the numbers for 2018, there is a big 38% jump in St. Davids followed by 17% in Glendale and 11% in Old Town. However, it’s important to note that the final number of eligible electors will be lower – in 2014, there was a 7% drop from the initial potential voter count to the final eligible voter count. Nonetheless, the changes will affect the composition of the voter profile – if the newcomers end up voting. We saw in 2014 that some polls such as Glendale have low voter turnout (see article).
“Potential electors are typically based on the preliminary list of electors we receive from MPAC,” NOTL Town Clerk Peter Todd explained to me by email. “This same corporation provides us a much more accurate list closer to the election which is revised significantly due to changes at the polls and prior to voting day. The count for the election turnout is based on eligible electors.”
When I asked when we will learn the final counts for eligible voters in 2018, Todd responded: “This number is pretty fluid being that we have many people making revisions to the voters’ list. However the number that we used to calculate the expense limit for candidates which was the number of eligible electors as of September 25th was 14,213.”
The 14,213 count of eligible electors is an increase of 736 voters or 5.5% compared to 2014.
Note about provincial riding turnout
In 2014, the local turnout for the Niagara Falls riding was 51.2%, in line with the provincial average. When I asked Elections Ontario for the June 2018 voter turnout for the local riding, they responded: “Results for voter turnout will be published with the official election results. Official results will be available after they have been tabled in the Ontario Legislature. The process to table election results can take up to six months after a general election.”