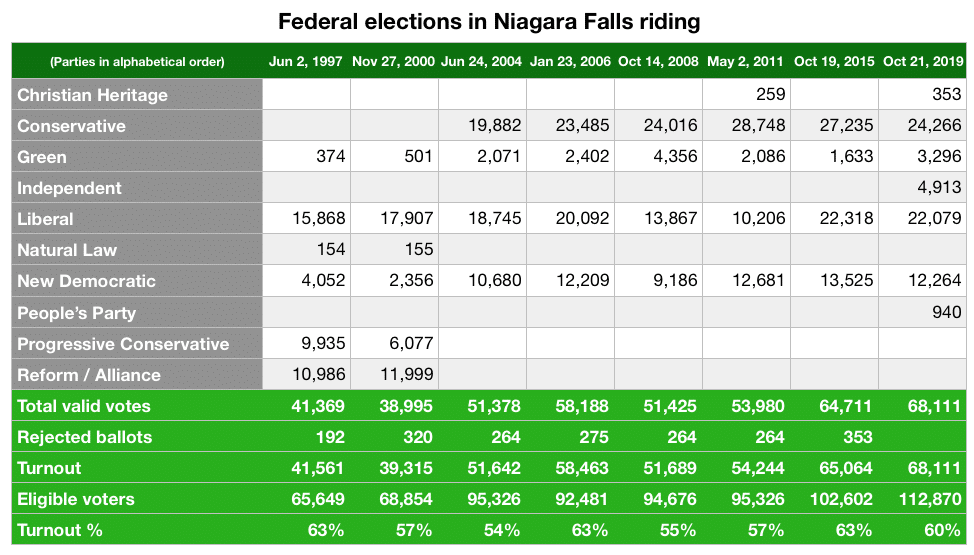
It’s not really a surprise that Conservatives held the Niagara Falls riding in the Oct. 21 federal election. However, it’s notable that, among the field of seven candidates, 9,502 votes – 14% of those cast – went to four candidates outside the three main parties. The share of votes for the Liberal and NDP candidates remained within their range of results in the previous five elections, but the Conservatives dropped to 35.6% of the election night tally.
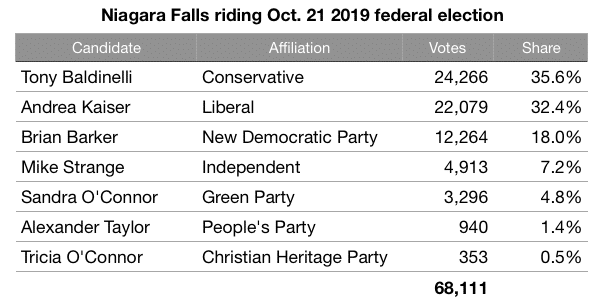
The retirement of long-time Member of Parliament Rob Nicholson attracted a field of seven contenders. With Nicholson’s endorsement, Tony Baldinelli held the riding for the Conservatives.
The Conservative had lost the riding to the Liberals in 1997 and 2000 when the Tory schism divided voters between Reform and Progressive Conservatives. Since patching up their differences, the Conservatives have held the riding. But in 2019, the strong 7.2% share for independent Mike Strange may have eroded the Conservative share. The Liberal’s Andrea Kaiser at 32.4% was close to the high end of its party results since 2004. Also in a relatively consistent range, the NDP’s Brian Barker drew 18% and the Green’s Sandra O’Connor attracted 4.8%.
Trend of affiliation support
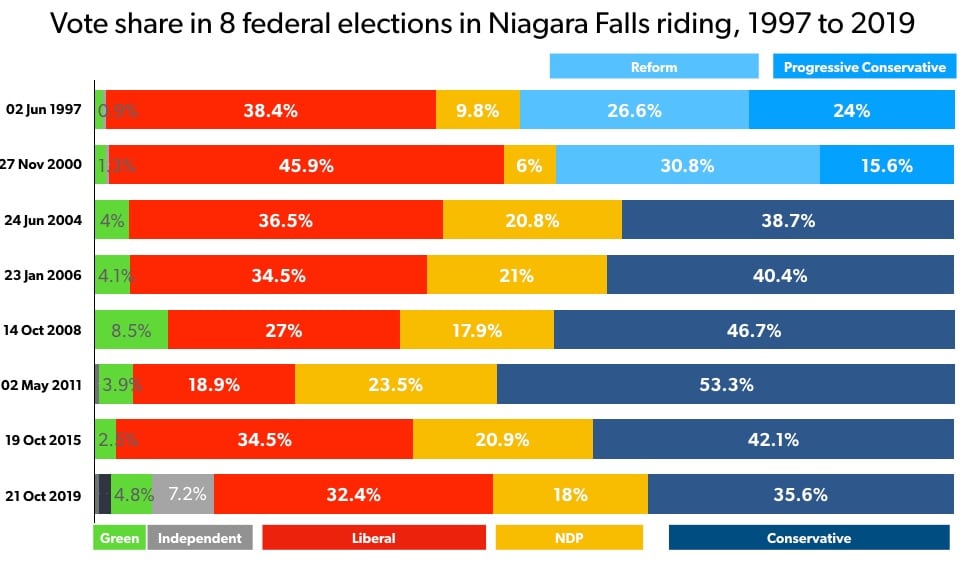
In order to gauge the trend in voter support for different parties, I created the chart below that shows eight federal elections. In 1997, the Liberals won due to the Conservative schism that split votes between the Reform and the Progressive Conservative parties. Starting in 2004, redistribution changed the size and shape of the riding, adding NDP voters in Fort Erie.
In the 2019 election at the bottom, the blue section showing Conservatives is more squeezed than in recent elections. However, the red section showing Liberal votes and the orange segment showing the NDP share land within the range for each party in the past six elections.
Niagara Falls riding complexion
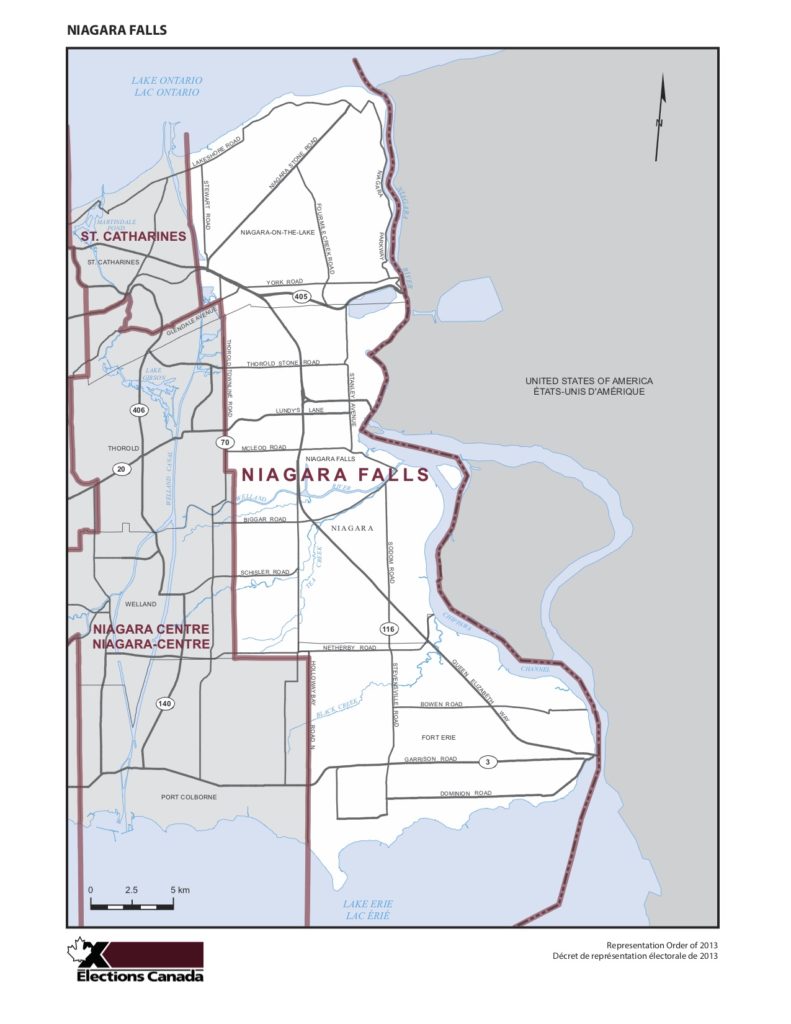
As noted, the New Democratic Party share of votes increased appreciably after redistribution in 2004. The riding’s western boundary moved east from the Welland Canal to the Thorold town line. The southern boundary moved to the Lake Erie shoreline. As a result, the riding now excludes the town of Thorold and includes all of the town of Fort Erie.
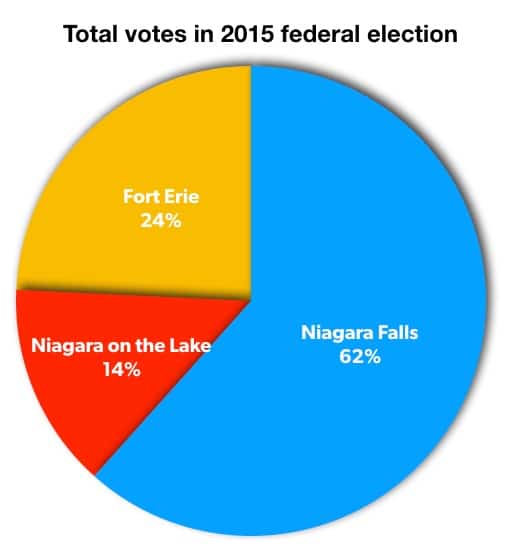
In order to calculate the relative support across the riding in the 2015 election, I downloaded the Elections Canada data for the 276 polls and created subtotals for each of the municipal areas. Significantly, about 61% of votes were cast in Niagara Falls, with 24% in Fort Erie and 14% in Niagara on the Lake. The heavy weighting for Niagara Falls is illustrated by this pie chart of the votes.
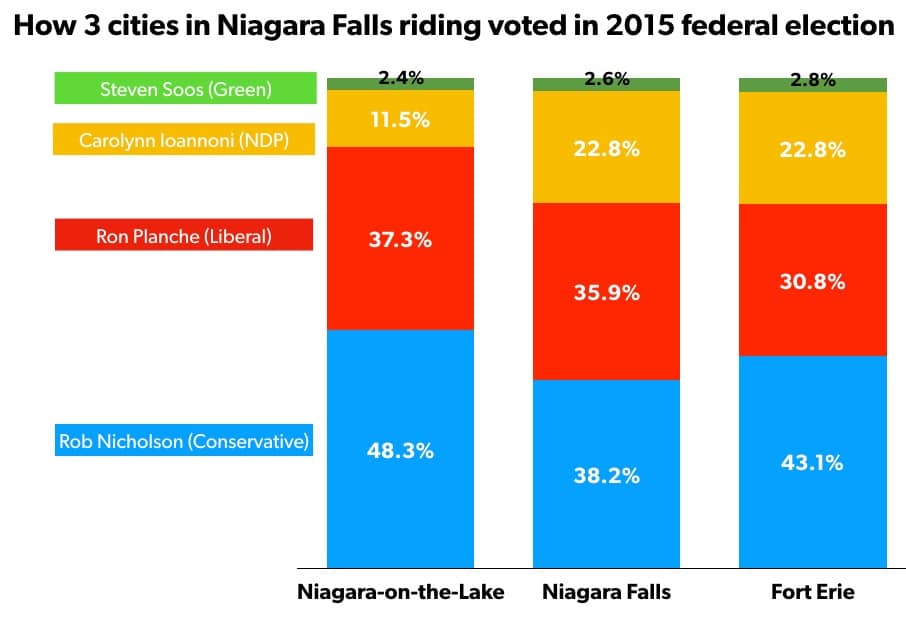
All three cities favoured the Conservatives in 2015, most notably Niagara on the Lake which has a sizeable mix of working farmers and wealthy retirees. Voters in Niagara Falls and Fort Erie were twice as likely as those in NOTL to vote NDP. The Green party was consistent across the riding.
We don’t yet have final polling station results from the 2019 election to look at the support across the three municipalities.
Voter turnout 60%
Finally, the 60% voter turnout in 2019 is at the high end of the range of 54% to 63% for the past eight elections.
